
At 6.71%, the Freddie Mac rate for the week of September 3, 2026, buying a two-to-four unit home, living in one unit and renting the rest costs less than renting a one-bedroom in 8 of 83 U.S. metros. At 6.00% that count is 13; at 7.50% it is 7. Every figure comes from re-running the Foothold Index screen of 23,424 listings at each rate, with prices and rents held where they were on August 6, 2026.
Rate-cut coverage always says the same thing: lower rates help buyers. True, and not useful, because it does not say how much or where. This page answers that for one buyer: a first-timer who plans to house hack a duplex, triplex or fourplex with an FHA loan and 3.5% down. At each rate, does the median deal that passes my seven screening gates keep money in the buyer’s pocket compared with renting a one-bedroom nearby?
Update, September 16, 2026: daily mortgage rates passed 7% after the Fed’s first hike since 2023 and a bond market selloff. For what that means at 7.00% and above, see the Fed rate hike and your mortgage.
How many metros does a rate cut open up?
The short version: a full point off the September 3 rate (6.71% to about 5.75%) moves the count from 8 metros to 13. Three-quarters of a point up (to 7.50%, the top of the grid) only takes it to 7. A cut gains more than a rise loses: the metros just below the line (Memphis, Toledo, Grand Rapids, New Orleans, New York) are close, while five of the seven that win at 7.50% win by $160 a month or more.
| Mortgage rate | Metros where owning beats renting | vs. Sept 3 | Which metros change |
|---|---|---|---|
| 5.00% | 15 of 83 | +7 | adds Fort Wayne, Grand Rapids, Harrisburg, Memphis, New Orleans, New York, Toledo |
| 5.25% | 14 of 83 | +6 | adds Fort Wayne, Grand Rapids, Memphis, New Orleans, New York, Toledo |
| 5.50% | 13 of 83 | +5 | adds Grand Rapids, Memphis, New Orleans, New York, Toledo |
| 5.75% | 13 of 83 | +5 | adds Grand Rapids, Memphis, New Orleans, New York, Toledo |
| 6.00% | 13 of 83 | +5 | adds Grand Rapids, Memphis, New Orleans, New York, Toledo |
| 6.25% | 11 of 83 | +3 | adds Grand Rapids, Memphis, New Orleans |
| 6.50% | 9 of 83 | +1 | adds New Orleans |
| 6.71% | 8 of 83 | baseline | Albany, Buffalo, Chicago, Cleveland, Pittsburgh, Rochester, Syracuse, Youngstown |
| 6.75% | 8 of 83 | no change | same eight metros |
| 7.00% | 8 of 83 | no change | same eight metros |
| 7.25% | 7 of 83 | -1 | loses Chicago |
| 7.50% | 7 of 83 | -1 | loses Chicago |
“Owning beats renting” means the median surviving listing in that metro keeps a positive dollar amount per month after the full payment, taxes, insurance, mortgage insurance, a $200 reserve and the other unit’s rent are set against a one-bedroom rent. Metros with fewer than 10 surviving listings (Albuquerque, Birmingham, Detroit, Greensboro, Scranton) are left out. New York wins on the math at 6.00% and below but fails the index’s debt-to-income gate, so it never appears in the published ranking.
What a house hack keeps per month at each rate, by metro
This is the number behind the counts: dollars kept per month by the median surviving deal, against the local one-bedroom rent. Positive means owning costs less than renting. The 15 metros below are every metro that wins at any rate in the sweep.
| Metro | At 6.00% | At 6.71% (Sept 3) | At 7.00% | At 7.50% |
|---|---|---|---|---|
| Syracuse, NY | $819 | $708 | $662 | $565 |
| Rochester, NY | $638 | $558 | $530 | $457 |
| Albany, NY | $697 | $547 | $484 | $376 |
| Cleveland, OH | $405 | $328 | $289 | $223 |
| Buffalo, NY | $372 | $233 | $172 | $101 |
| Youngstown, OH | $289 | $230 | $205 | $163 |
| Chicago, IL | $367 | $169 | $44 | -$133 |
| Pittsburgh, PA | $295 | $153 | $98 | $1 |
| New Orleans, LA | $149 | -$35 | -$112 | -$247 |
| Memphis, TN | $51 | -$27 | -$59 | -$116 |
| Toledo, OH | $13 | -$55 | -$84 | -$134 |
| Grand Rapids, MI | $93 | -$118 | -$207 | -$330 |
| Fort Wayne, IN | -$69 | -$154 | -$186 | -$244 |
| Harrisburg, PA | -$161 | -$292 | -$346 | -$442 |
| New York, NY | $134 | -$377 | -$592 | -$947 |
What this means for you: in Rochester the swing from 6.00% to 7.50% is $638 to $457 a month. The deal never stops working. In Chicago the same swing is $367 to -$133. Same rate move, nearly three times the damage, because Chicago’s entry price ($449,000) is 2.8 times Rochester’s ($160,000) and the payment scales with the loan.
Which metros flip from owning to renting, and at what rate?
Eight metros cross the line somewhere inside the sweep. The table reads: the highest rate at which the median deal still keeps money, and the next quarter-point step at which it does not.
| Metro | Entry price | Still wins at | Loses to renting by |
|---|---|---|---|
| Chicago, IL | $449,000 | 7.00% | 7.25% |
| New Orleans, LA | $300,000 | 6.50% | 6.75% |
| Memphis, TN | $160,000 | 6.25% | 6.50% |
| Grand Rapids, MI | $279,000 | 6.25% | 6.50% |
| Toledo, OH | $134,900 | 6.00% | 6.25% |
| New York, NY | $899,000 | 6.00% | 6.25% |
| Fort Wayne, IN | $134,900 | 5.25% | 5.50% |
| Harrisburg, PA | $185,000 | 5.00% | 5.25% |
The catch: Pittsburgh holds on at 7.50% by a single dollar a month ($1). It is a win on paper and a coin flip in practice; a $50 change in insurance or a vacancy month decides it. Treat any metro inside $100 of the line as a maybe, in either direction.
Why a rate cut matters more in Chicago than in Rochester
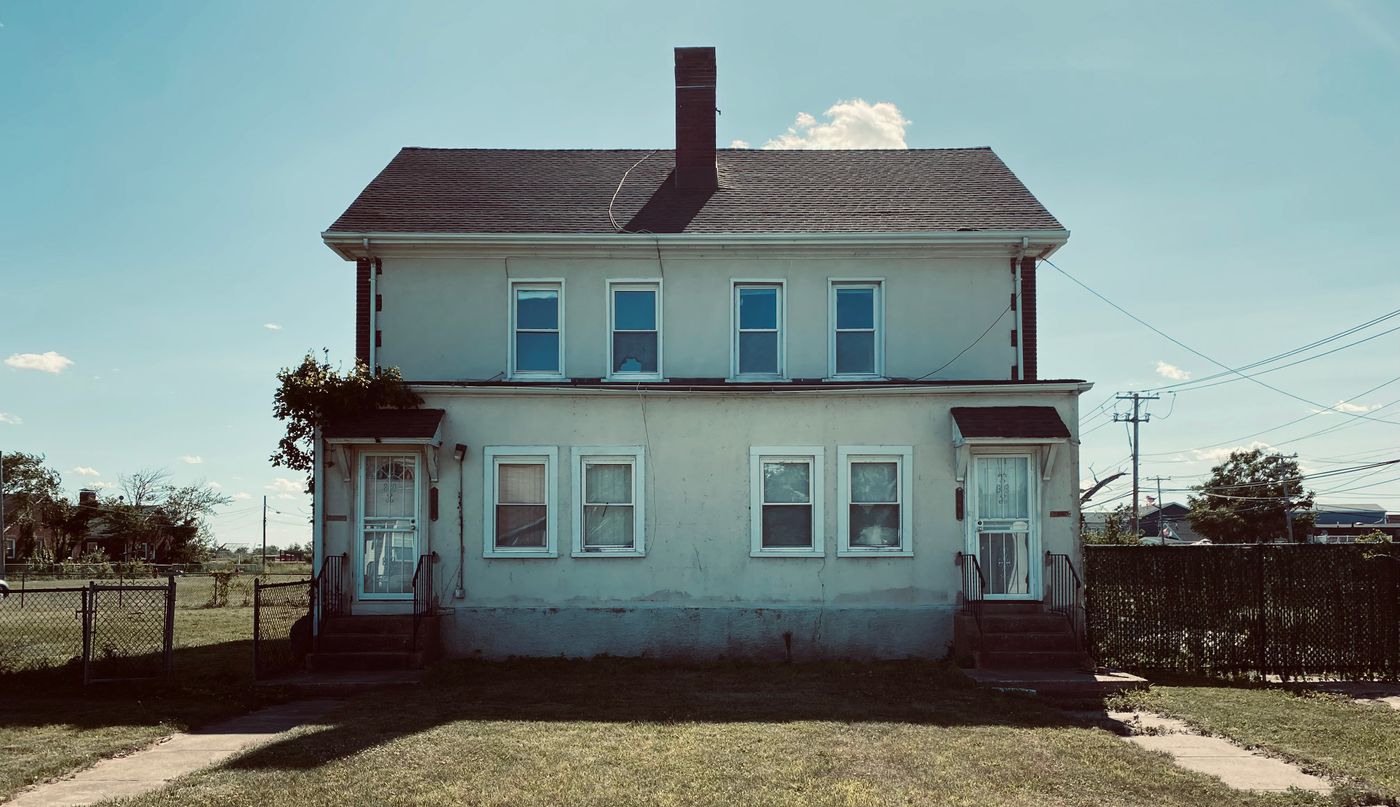
Principal and interest is the only line on the payment that moves with the rate, and it moves in proportion to the loan. A quarter point on a $157,000 loan (Rochester’s entry price with 3.5% down) is about $26 a month. The same quarter point on a $441,000 loan (Chicago’s) is about $73. Everything else on the payment (taxes, insurance, mortgage insurance, the reserve) is flat, and the rent from the other unit is flat.
The way to read it: cheap-entry metros are rate-proof. Syracuse, Rochester, Albany, Cleveland, Buffalo, Youngstown and Pittsburgh win at every rate from 5.00% to 7.50%, Pittsburgh only just. Expensive-entry metros are rate-sensitive: Chicago, New York and New Orleans swing by hundreds of dollars a month across the same range. If you are waiting for a cut before you buy, the wait changes the answer in the second group and in near-the-line metros like Toledo and Memphis.
Even a small change in the rate adds real money to a payment. I priced that out for my own duplex in what I would do differently at today’s rates; the wider write-up of how rates changed the map is in house hacking at today’s mortgage rates.
Method and limits
The Foothold Index screens 23,424 real two-to-four unit listings across 83 metros through seven livability gates: price floor, FHA loan limit, price per square foot, gross yield cap, crime, other-vacant share, and five-year price trend. 11,495 pass (August 2026 edition). The monthly math then runs the same way in every metro:
- Entry price is the 25th percentile of surviving listings; the payment runs on the median deal.
- FHA terms: 3.5% down, 1.75% upfront and 0.55% annual mortgage insurance, 30-year fixed at the sweep rate.
- County tax rate, a modeled insurance premium, and a $200 monthly reserve.
- Rent credited is the lower of the local one-bedroom rent and the HUD fair market rent.
What was held constant: everything except the rate. Listing prices are as of August 6, 2026; rents are the Zumper and Apartment List average, May to July 2026 (RentCafe in Cleveland and Scranton), and FY2026 fair market rents. A sustained rate cut lifts prices and a rise softens them, so the counts above are a ceiling on what a cut delivers and a floor on what a rise costs.
The baseline rate is the Freddie Mac 30-year average for the week of September 3, 2026 (6.71%). The grid runs in quarter points from 5.00% to 7.50%.
Download the full rate sweep
The sweep is a re-run of the published workbook with one dial changed, so every figure ties to the Foothold Index as published. Metros with fewer than 10 surviving listings (Albuquerque, Birmingham, Detroit, Greensboro and Scranton) are excluded from counts. The full sweep, 82 metros at all 13 rates (Scranton has no surviving listings, so it has no row), is a free download: vantovault-rate-sensitivity-2026-09-03.csv (CC BY 4.0). Its Buffalo row is the 3 September run, the same as this page (see the dated note below). It also sits with the rest of the open data.
To run your own building at your own rate, the house hacking calculator starts from this week’s rate, and own for less than you rent walks through the math on one Cleveland example.
Frequently asked questions
At what mortgage rate does house hacking beat renting?
The break-even rate is defined as the mortgage rate at which the median surviving duplex deal in a metro keeps zero dollars a month against renting a one-bedroom. It differs by metro: Rochester, Syracuse, Albany, Cleveland, Buffalo, Youngstown and Pittsburgh still win at 7.50 percent, Chicago loses to renting between 7.00 and 7.25 percent, and Toledo, Memphis and Grand Rapids flip between 6.00 and 6.50 percent.
How much does a one-point rate cut change a house hack payment?
A one-point rate cut is defined here as a move from 6.71 percent to about 5.75 percent on a 30-year FHA loan. On a $157,000 loan (Rochester’s entry price with 3.5 percent down) it lowers principal and interest by about $98 a month; on a $441,000 loan (Chicago’s) by about $275. Across the 83-metro index it moves the count of metros where owning beats renting from 8 to 13.
Which cities are the most rate-proof for house hacking?
A rate-proof metro is defined as one where the median surviving deal keeps positive money at every rate from 5.00 to 7.50 percent. In the August 2026 screen those are Syracuse, Rochester, Albany, Cleveland, Buffalo, Youngstown and Pittsburgh, all with entry prices between $127,500 and $269,900.
Does this table account for prices changing when rates change?
No. The rate sensitivity table is defined as a one-variable re-run: the mortgage rate changes and every price, rent, tax and insurance figure stays at its August 2026 value. Because lower rates tend to lift prices, the counts at lower rates are a ceiling on what a cut delivers, not a forecast.
Sources & methodology
- Freddie Mac Primary Mortgage Market Survey, 30-year fixed average 6.71%, week of September 3, 2026.
- VanToVault Foothold Index, 23,424 listings screened, 11,495 surviving, data as of August 6, 2026; workbook v7, mortgage-rate dial re-run at 13 rates on September 3, 2026.
- Rents: the one-bedroom figure is the average of Zumper and Apartment List metro asking rents (May to July 2026; RentCafe stands in for Zumper in Cleveland and Scranton; Buffalo’s row uses the workbook’s 3 September input, the Zumper and Apartment List average, and the Buffalo page has since moved to RentCafe’s published figure); HUD FY2026 Fair Market Rents.
- Full sweep dataset: vantovault-rate-sensitivity-2026-09-03.csv, CC BY 4.0, also on the open data page.
Every figure on this page is a direct output of the published Foothold workbook with the mortgage-rate dial changed and nothing else; no figure is modeled outside it. Last computed: September 3, 2026.
Note added 24 September 2026: the Buffalo row is the 3 September 2026 run, on the same August 2026 inputs as every other row. Buffalo has since been re-run with RentCafe’s published one-bedroom rent ($1,301, updated August 31, 2026), and the current Buffalo figures are on the Buffalo page.[S1]
Get started with the newsletter!
Useful, relevant analysis, tools, tricks, and what you need to know on the journey to financial freedom. From the van years to a duplex, the plain math and none of the hype.
Subscribe and get the free $0-to-First-Property Roadmap to start.
No spam. Unsubscribe in one click.
Want the deeper toolkit? The guides and spreadsheets are in the shop, from $5, and the free tools stay free either way.
Sources
- [S1] Van to Vault, read 24 September 2026: “Mortgage Rates vs. Renting: Where a Duplex Wins at Each Rate; Fed Rate Hike 2026” vantovault.com.